
10 Dashboard Reporting Tools for Local SMBs

The best dashboard reporting tools depend on the job. Looker Studio fits low-cost Google stack reporting, agency reporting platforms make recurring client reports easier, and BI tools like Power BI or Tableau fit deeper modeling and governance.
The question isn't which dashboard looks best. It's which one helps a local business connect Google Ads, GA4, calls, CRM outcomes, and lead quality without turning reporting into a weekly cleanup project. Plenty of teams buy dashboards, but daily use still lags badly across the broader BI category. Analytics and BI usage rose in 87% of surveyed organizations, yet only 29% of employees actively use the tools, and IBM notes that this figure has barely moved over roughly seven years in its review of BI adoption.
For local service companies in Prescott, Prescott Valley, Chino Valley, Dewey-Humboldt, and across Northern Arizona, that gap matters. Silva Marketing works with businesses that don't need more charts. They need reporting that shows what turned into calls, booked jobs, qualified leads, and revenue decisions. As a Prescott-based digital marketing agency, Silva Marketing helps local businesses turn clicks into customers through custom websites, SEO, and Google Ads, and that makes the reporting standard higher than "traffic went up."
This roundup compares ten dashboard reporting tools by integrations, strengths, limitations, pricing structure, real use cases, and implementation effort. The lens is practical: can the tool handle day-to-day reporting for local SMBs, owner-operators, and agencies without overbuilding the stack?
Do you need a simple dashboard, an agency platform, or full BI?
If your business mostly needs Google Ads, GA4, Search Console, and lead summaries in one clean view, a simple marketing dashboard is usually enough. If you're sending recurring reports to clients or multiple locations, an agency platform is the better fit. If you need governed data models, strict permissions, or deeper joins across CRM, finance, and operations, full BI makes more sense.
Table of Contents
Do you need a simple dashboard, an agency platform, or full BI?
1. Google Data Studio (Looker Studio) - Where Looker Studio works well - Where it starts to strain
Choose the Dashboard That Drives Better Decisions - Which dashboard reporting tools work with Google Ads and GA4 - Does a local business need paid dashboard software - How should a local business report calls and leads - How often should dashboards be reviewed - What should a business watch besides marketing KPIs
1. Google Data Studio (Looker Studio)
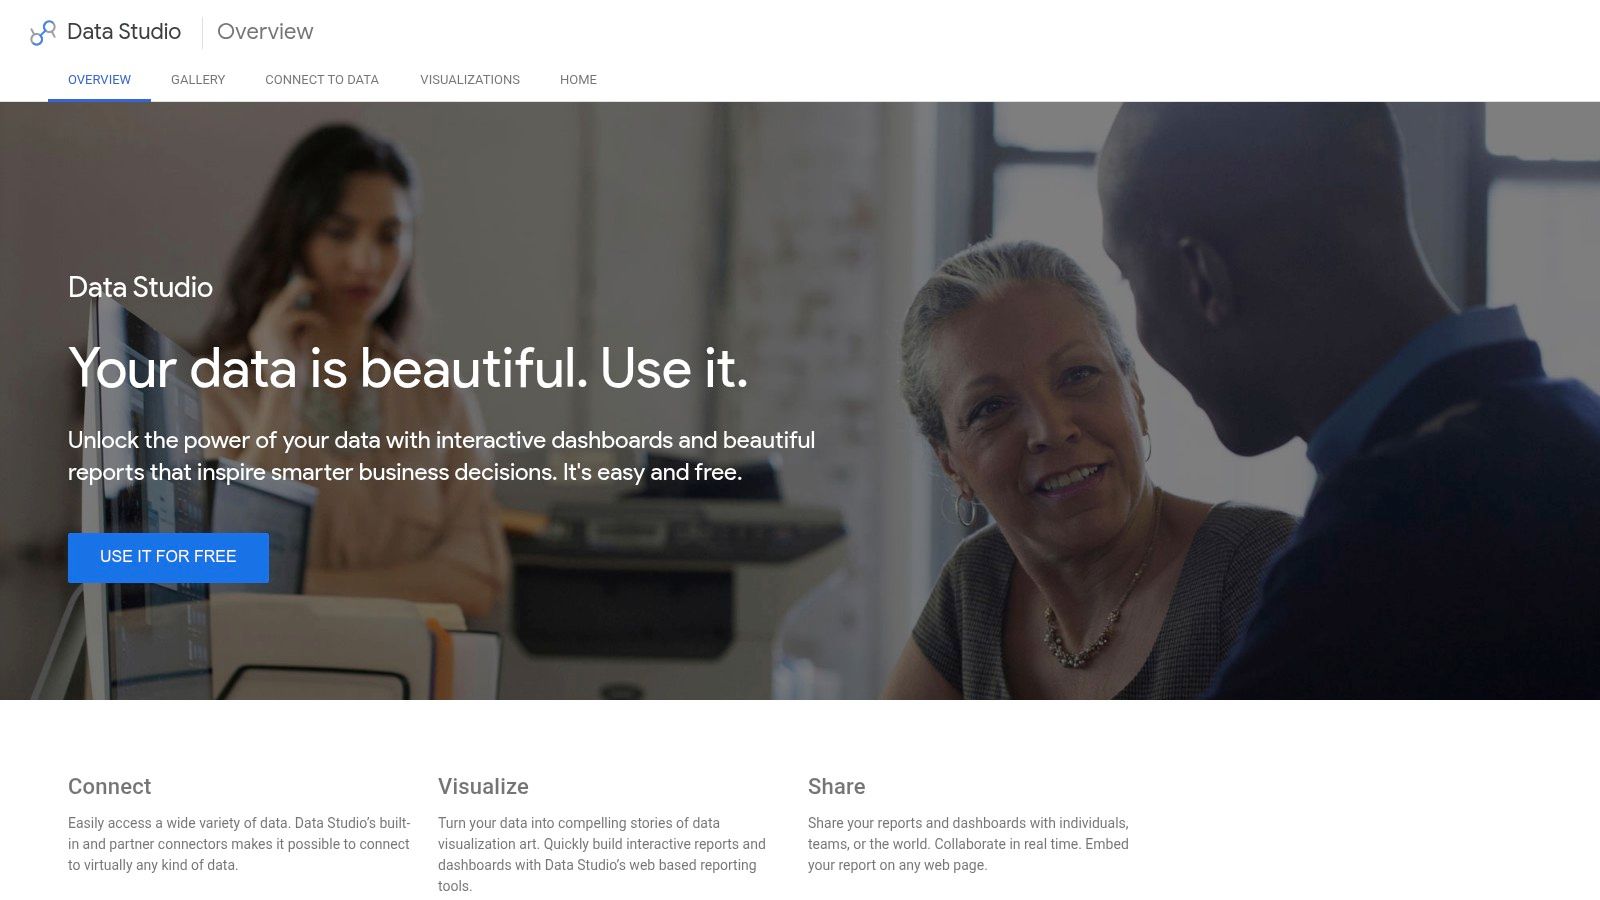
Looker Studio is still the default starting point for many local businesses, and for good reason. If your reporting world lives mostly inside Google Ads, GA4, Search Console, Google Sheets, and BigQuery, it gets you to a usable dashboard fast without forcing you into a heavy BI implementation.
For Prescott-area contractors, home service companies, med spas, legal firms, and multi-location local brands, Looker Studio works best when the reporting questions are straightforward. How many leads came in, what did they cost, which campaigns drove them, and what happened on the site? That use case is exactly where it stays efficient.
Where Looker Studio works well
Its biggest strength is proximity to Google's ecosystem. You can build clean scorecards, trend charts, and channel views quickly, then share them by link or embed them in a client portal.
A few practical wins stand out:
Google-native reporting: It fits GA4, Google Ads, Search Console, Sheets, and BigQuery naturally.
Low barrier to entry: The free version is enough for many SMB dashboards.
Familiar delivery: Owners and managers can open a live link instead of waiting on PDFs.
If you're cleaning up paid search reporting, solid tracking matters more than visual polish. Silva Marketing's guide to Google Ads conversion tracking setup gets at the bigger point. A dashboard is only as useful as the events and conversions feeding it.
Practical rule: Use Looker Studio when your main challenge is organizing Google marketing data, not when your main challenge is rebuilding a messy data model.
Where it starts to strain
Looker Studio gets less comfortable when you push hard on blended data, connector reliability, or multi-client governance. If you need polished white-label agency workflows, annotation-heavy client reporting, or dependable joins across ad platforms and CRM records, you'll hit friction faster than expected.
It also relies heavily on connector quality. That's fine for many local SMB setups, but once reporting needs expand across several systems, another tool may save more time than it costs.
2. AgencyAnalytics
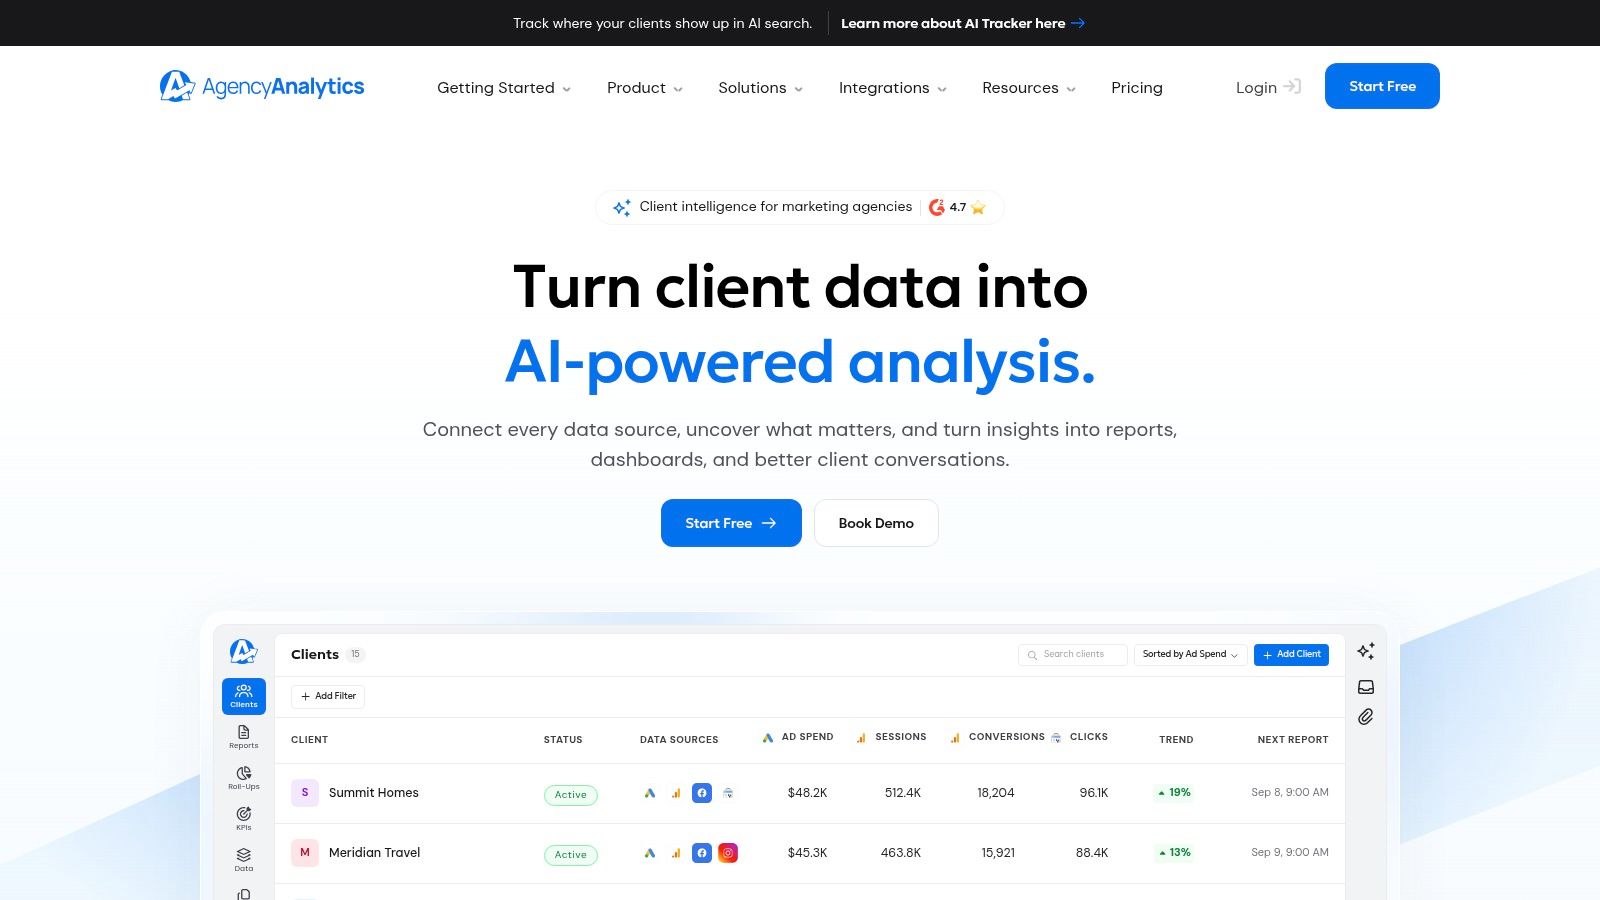
How much time does your team spend building reports versus explaining them?
AgencyAnalytics earns its place because it is built around the reporting habits of agencies, not analysts. For local service clients, that usually means pulling Google Ads, GA4, call tracking, SEO, and basic lead data into one place, then packaging it in a way an owner can read in two minutes. That sounds simple. In practice, many tools make it harder than it should be.
AgencyAnalytics handles client communication better than platforms that were designed mainly for in-house analysts. The portal, scheduled reports, and account structure fit recurring client work well, especially if your agency manages several small to midsize accounts at once. A plumbing company with multiple service areas, a med spa with separate campaigns by location, or a home services group with paid search and local SEO under one roof all fit this model.
What stands out in daily use is operational efficiency.
You connect the common marketing sources, set a reporting layout once, clone it across accounts, and spend more time reviewing signal than formatting slides. For agencies serving SMBs, that matters more than having endless chart options.
A few strengths show up quickly:
Client-ready delivery: Branded portals and scheduled reports cut down on manual monthly reporting.
Good fit for multi-account work: The platform is easier to standardize across many clients than general BI tools.
Clearer rollups: Multi-location and multi-service reporting is manageable without building a custom data stack.
Lower training burden: Account managers can work inside it without needing analyst-level reporting skills.
It also matches the kind of KPIs local businesses ask about. Leads, cost per lead, booked jobs, top channels, location performance, and month-over-month movement are easier to present cleanly here than in a tool built for heavier analysis. If your team is aligning reports to SEM performance metrics for service businesses, this platform fits that cadence well.
The trade-off is flexibility. AgencyAnalytics is strong when the job is repeatable client reporting. It is less convincing when you need custom attribution logic, complex joins between ad data and CRM opportunity stages, or warehouse-style modeling across many sources. You can get a lot done inside the product, but there is a ceiling.
That ceiling matters more for some agencies than others. If your clients mainly need understandable reporting and consistent delivery, AgencyAnalytics saves time. If your reporting process depends on stitching raw platform data to CRM records, offline conversion imports, and revenue reporting with strict definitions, you may outgrow it and need a more configurable BI setup.
Practical rule: Choose AgencyAnalytics when the priority is efficient client reporting for many SMB accounts, not deep custom analysis.
3. DashThis
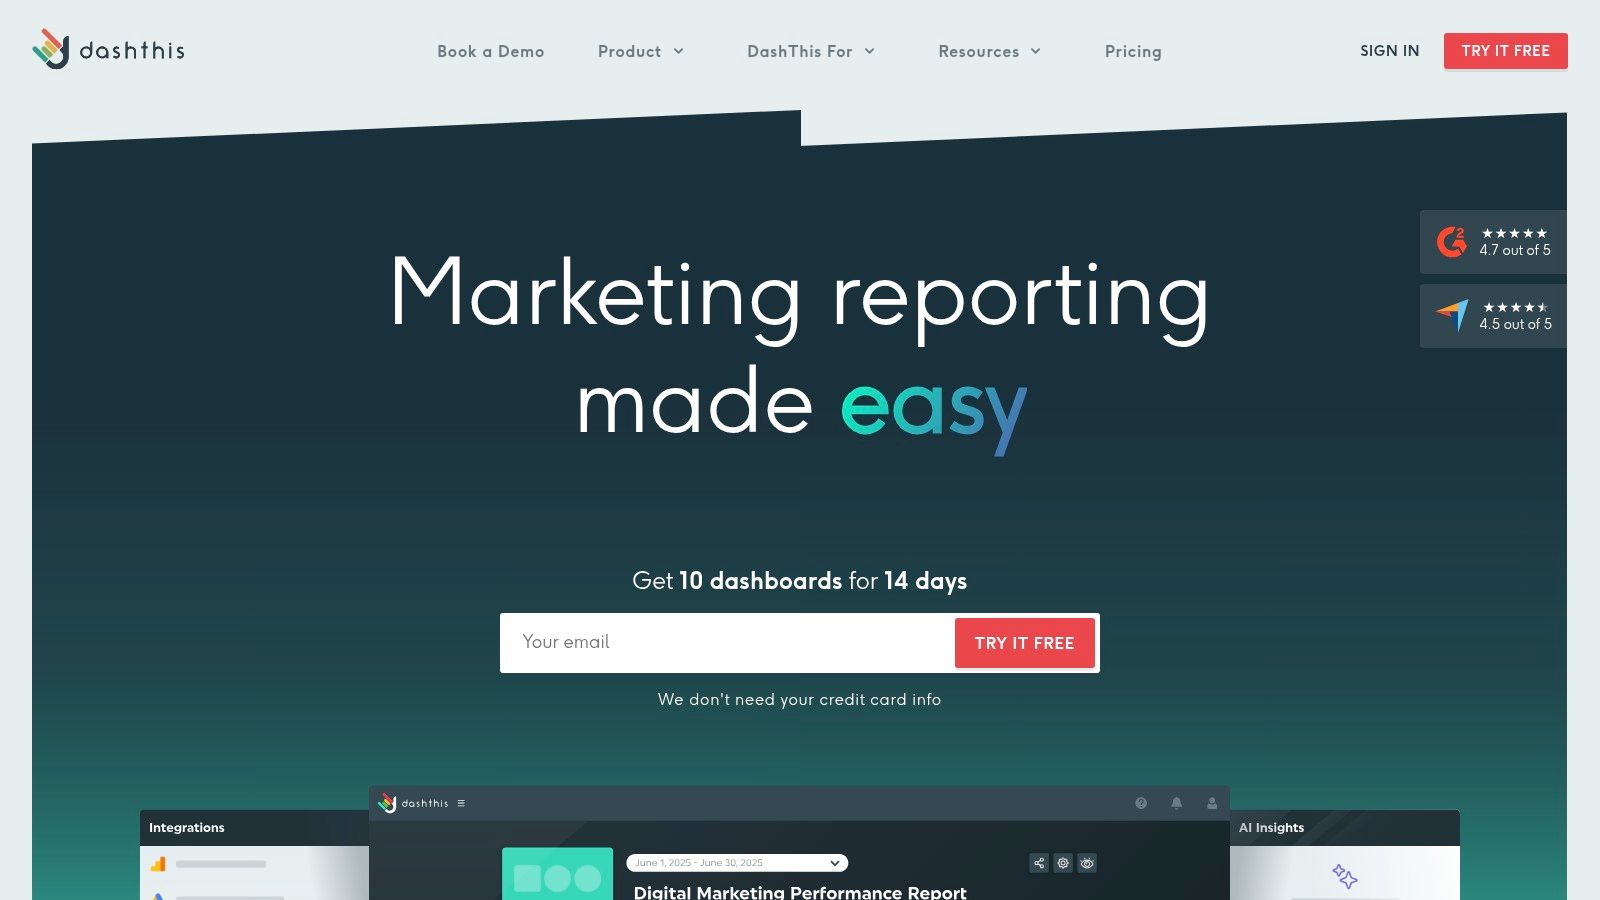
DashThis works best for teams that need to get a client report out the door without turning reporting into a side project. For local service companies and SMB-focused agencies, that usually means pulling in Google Ads, GA4, call or lead data, and a few headline KPIs, then packaging them into something an owner can scan in a few minutes.
That reporting style is narrower than full BI, but often more useful.
A plumbing company owner, franchise operator, or small medical practice usually is not asking for open-ended analysis. They want to know how many leads came in, what those leads cost, whether branded search is carrying too much of the account, and whether booked work is tracking with ad spend. DashThis handles that kind of monthly or weekly readout well because it keeps the report focused.
The strength here is format discipline. DashThis pushes teams toward a fixed reporting structure, which is helpful if your agency runs recurring deliverables across many accounts and wants account managers to spend less time rearranging widgets and more time checking whether the numbers make sense. White-label output also helps when clients expect polished PDFs or dashboard links without a lot of explanation.
Where it starts to strain is the handoff between marketing metrics and business metrics. If your process depends on tying ad platform data to CRM stages, validating lead quality by location, or separating raw leads from booked jobs and closed revenue, DashThis can feel too report-first. You can present the outcome, but building custom logic behind it is not its strong side.
Pricing and account growth matter here too. A simple setup stays efficient. A multi-location service business with several ad accounts, multiple stakeholders, and extra data sources can hit the point where the convenience drops and the reporting model feels cramped.
Use DashThis if the main job is clear, repeatable reporting for SMB clients who want a clean story each month. Skip it if your team needs to answer second- and third-order questions inside the tool, or if your reporting depends on CRM and attribution logic that changes often.
4. Databox
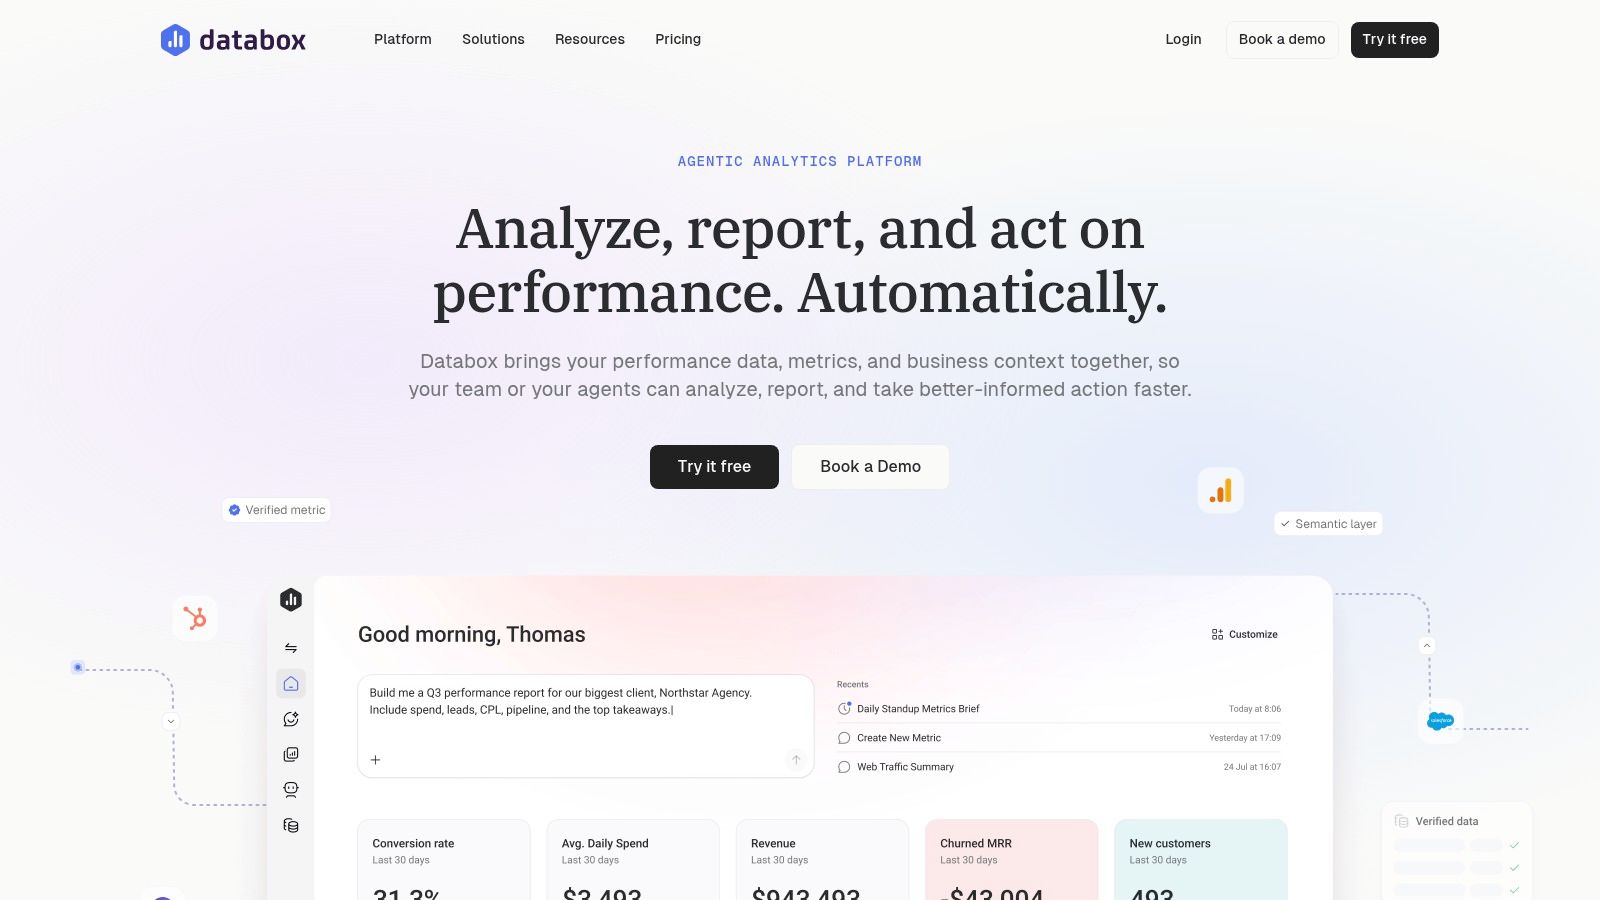
Databox fits teams that need the numbers in front of them every day, not just in a month-end report. For a local service business, that usually means one screen showing leads, calls, booked jobs, cost per lead, and maybe a few sales metrics pulled from the CRM. For an agency, it means clients can check pacing without asking for an update.
That day-to-day visibility is Databox's real value.
I like it most for businesses that already know which KPIs matter and want them monitored in one place. Google Ads, GA4, call data, and CRM totals can come together fast enough to make the dashboard useful before the setup turns into a project. If your team needs a shared scoreboard for the owner, office manager, sales lead, and marketer, Databox usually gets there with less friction than a BI tool.
It also works well for agencies managing several SMB accounts. A top-level rollup can show which clients are on pace, which ones slipped on lead volume, and where account managers need to look closer before the weekly call.
If your site is part of that path from click to lead, Silva Marketing's post on website visitor tracking explains why reporting should connect visitor behavior to lead outcomes, not just traffic totals.
The trade-off shows up once reporting moves past KPI monitoring and into custom business logic. Databox can display CRM and marketing metrics well, but teams that need heavy transformation work often hit limits. Common examples are lead scoring by service type, separating spam from qualified leads, mapping booked jobs back to campaign groups, or handling location-by-location attribution rules that change often.
So the question is simple. Do you need a live operating dashboard, or do you need a system for modeling messy data?
Choose Databox when the main job is keeping performance visible and understandable across marketing and sales. Pass on it if your reporting depends on complex joins, changing attribution logic, or deep analysis inside the platform itself.
5. Whatagraph
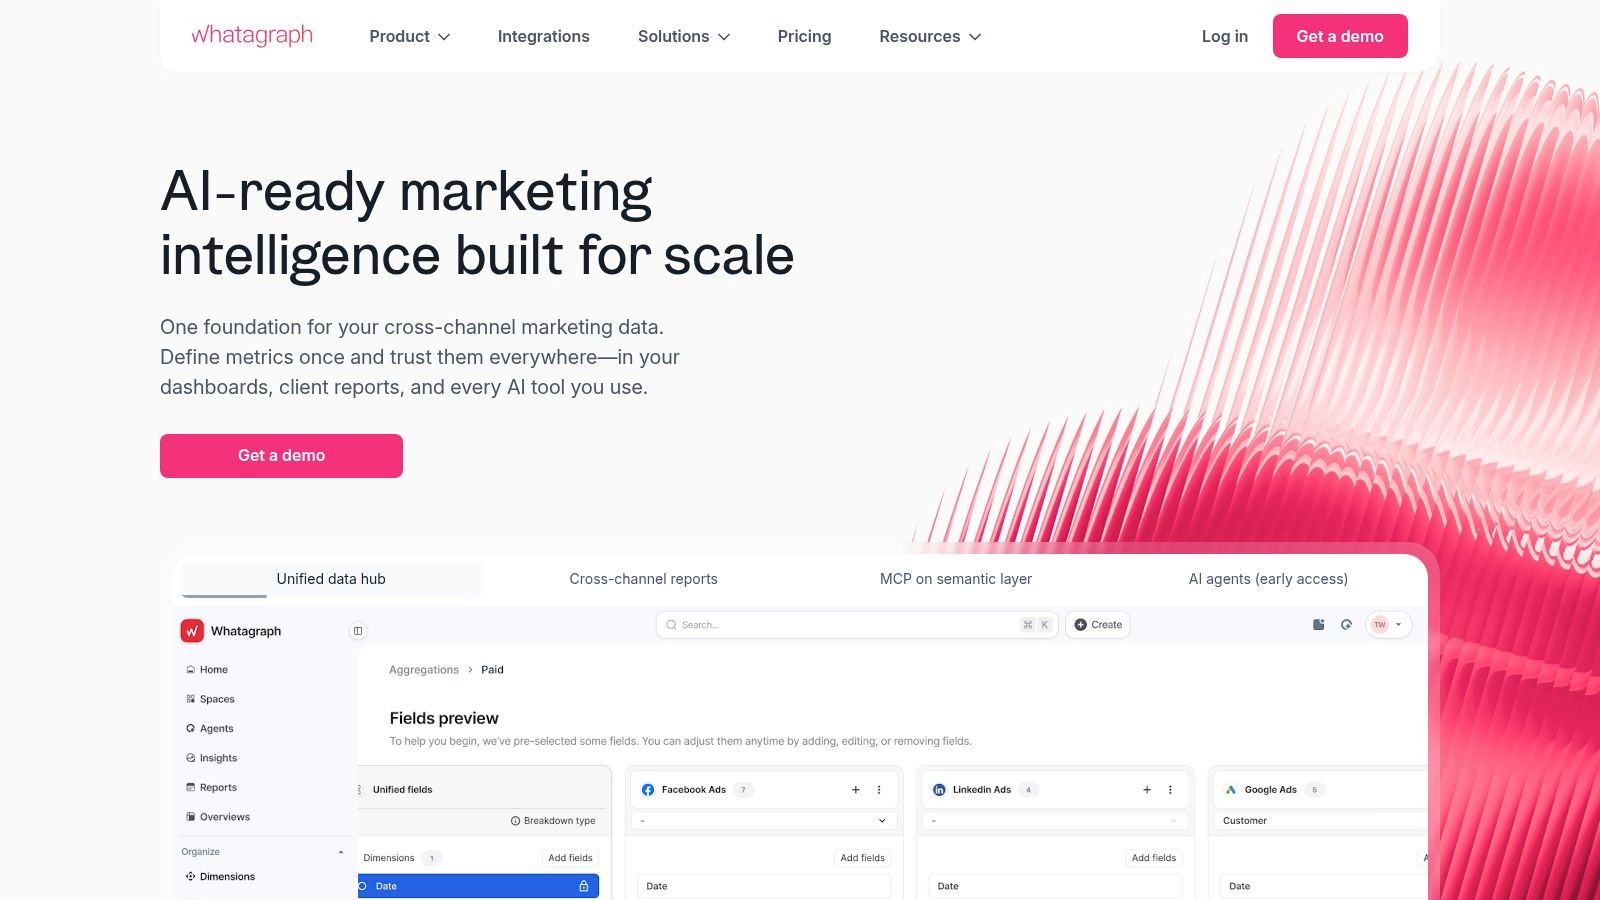
What happens when the report has to do two jobs at once. Show performance clearly and look polished enough for a client, owner, or franchise manager to take it seriously.
That is where Whatagraph tends to earn its keep. It is built for teams that send reports often and cannot spend half the month cleaning up screenshots, fixing chart layouts, or rewriting the same summary for each account. In agency work, that matters. In local-service businesses with several decision-makers, it matters too.
The appeal is not just aesthetics. Whatagraph is good at pulling together the mix SMBs usually care about: Google Ads, GA4, social channels, and CRM or lead data that helps explain whether marketing is driving calls, forms, and booked work. If your reporting goal is to give a business owner a clean read on spend, leads, cost per lead, and trend lines by channel, it fits that job well.
I would put it in the "presentation-first reporting" camp. That is different from a KPI monitor like Databox and different from a heavier analysis tool like Power BI. Whatagraph works best when the numbers are mostly defined already and the main task is packaging them into reports people will read.
A common use case looks like this: an agency manages paid search, SEO, and call tracking for several home service clients. The account manager needs monthly reports that tie ad spend and traffic to lead volume, call quality, and pipeline outcomes without sending a confusing wall of charts. Whatagraph handles that workflow better than tools that feel more builder-centric.
That also lines up with the reporting mindset in Silva Marketing's article on how to measure SEO ROI. Clean presentation helps, but the report still needs to connect rankings, traffic, and conversions to revenue decisions.
Use it if report delivery is part of the service.
Skip it if your team still needs to sort out messy attribution rules, heavy data cleanup, or custom joins across multiple systems. Whatagraph can present cross-channel performance well, but it is not the place I would choose to model complex lead-routing logic, separate spam from qualified leads at scale, or build location-specific attribution rules that change every month.
Price also matters here. For a single small business that only needs a simple internal dashboard, Whatagraph can feel like more tool and more cost than necessary. For agencies or multi-location operators who send polished recurring reports, the time saved usually makes the case.
6. Klipfolio (Klips and PowerMetrics)
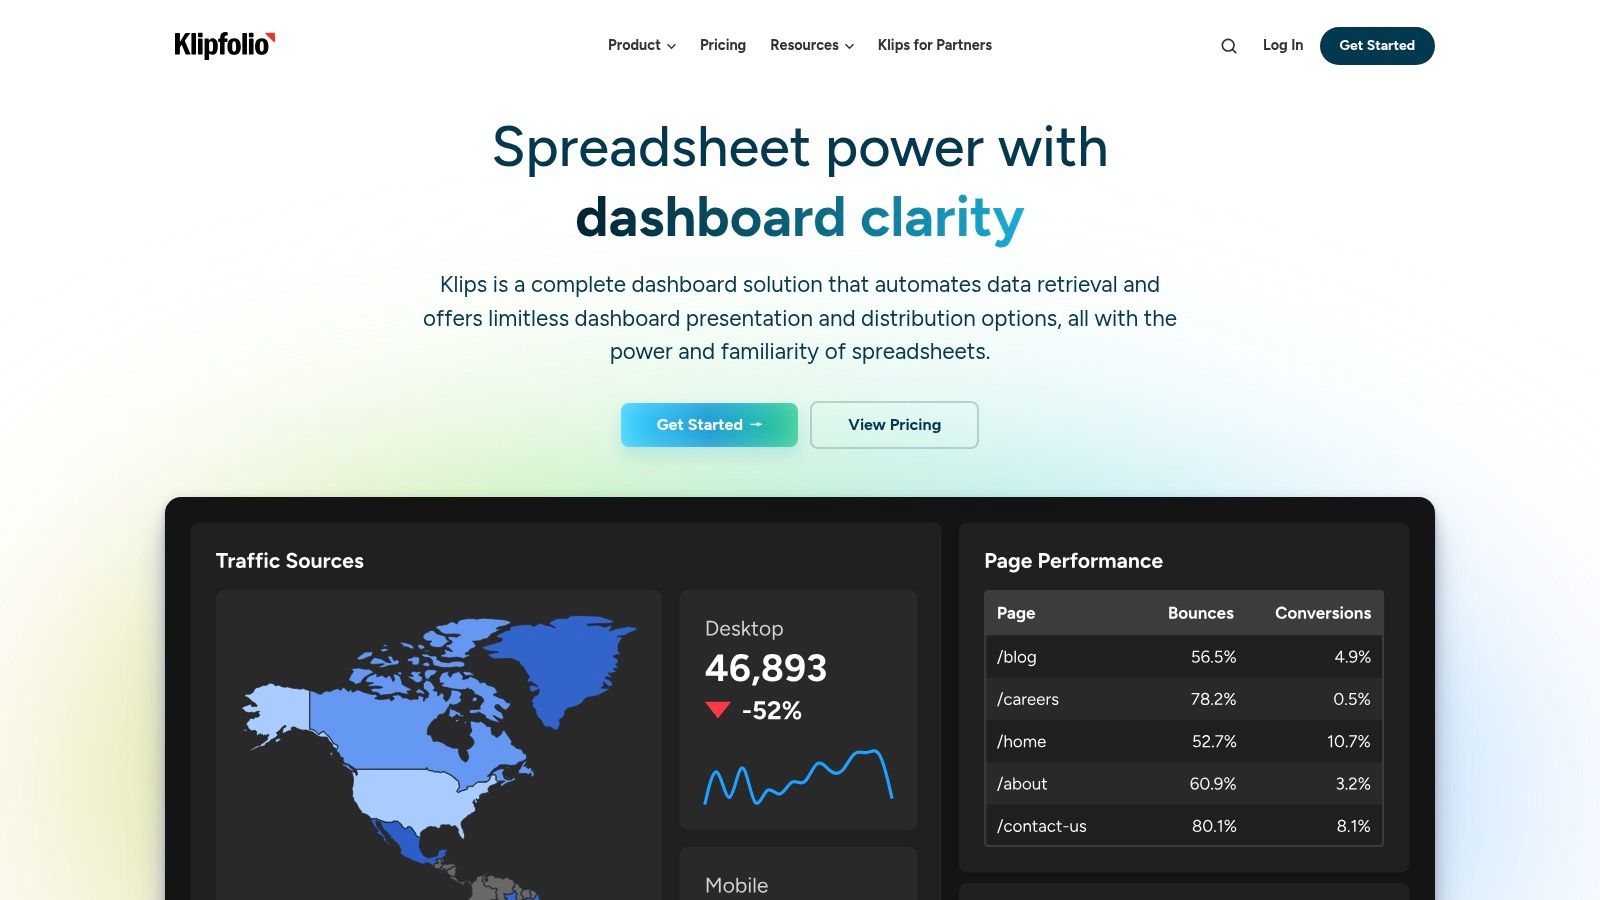
Klipfolio starts to make sense when a service business or agency has outgrown canned marketing dashboards, but still does not want a full BI project.
The split product matters. Klips is the more hands-on side. PowerMetrics is better when the problem is metric consistency across locations, clients, or departments. That distinction is useful for SMB teams deciding whether they need a builder, a scorecard system, or both.
Here is the day-to-day fit. A local agency might need to pull Google Ads, GA4, call tracking, and CRM lead stages into one client view, then create a separate owner dashboard that strips out the marketing jargon. Klipfolio can handle that middle-ground job well, especially when template tools start feeling too rigid but Power BI would be overkill for the team maintaining it.
What I like about Klipfolio is its willingness to meet messy reporting halfway. You can shape dashboards around booked jobs, qualified calls, close rates, or service-line performance instead of stopping at clicks and sessions. For home services, legal, healthcare, and other lead-driven local businesses, that flexibility matters more than flashy visuals.
The trade-off is clear. Klipfolio rewards a team that knows how it wants to define metrics. If your reporting logic is still changing every month, or nobody owns dashboard upkeep, setup can drag. Freedom is helpful right up until every client dashboard becomes its own small custom project.
A practical way to choose between its two products:
Use Klips if you need custom dashboard layouts, mixed data sources, and more control over how metrics are displayed.
Use PowerMetrics if leadership wants standardized KPIs across many reports, locations, or client accounts.
Skip both for now if the business still has unresolved CRM hygiene, inconsistent conversion tracking, or unclear lead qualification rules.
Klipfolio fits teams that are serious about reporting but not ready to hire around analytics engineering. That is a solid niche. For agencies serving SMBs, or operators juggling marketing and sales data across a few locations, it can be the right level of complexity if someone on the team is prepared to build with intention.
7. Geckoboard
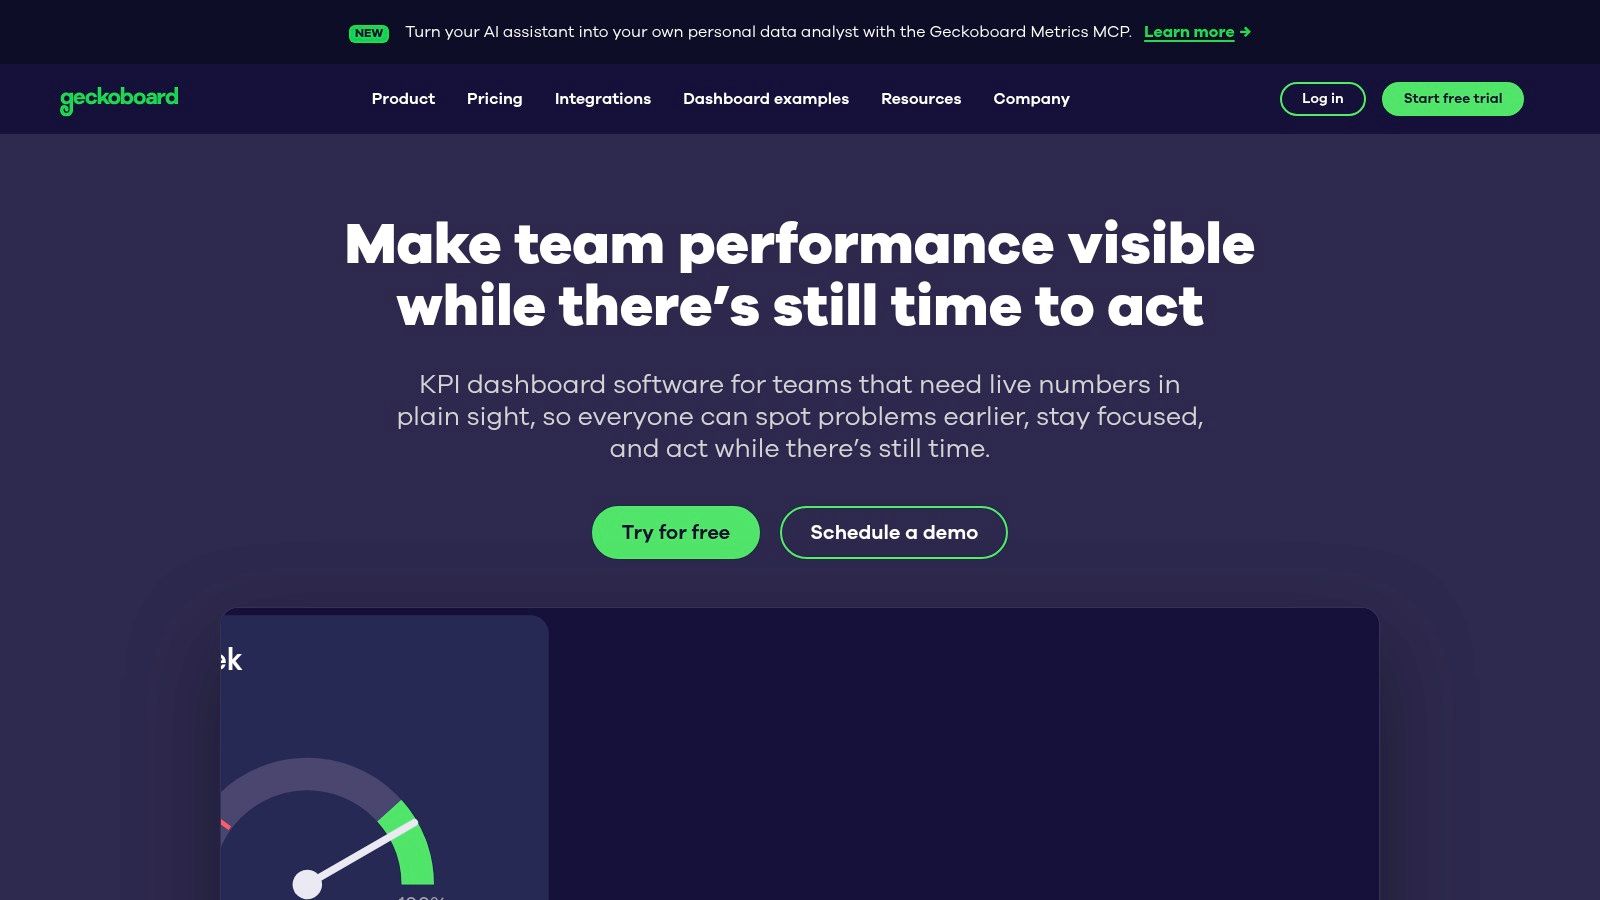
Need a dashboard your front office will look at?
Geckoboard works best when the job is simple and visible. A local service business can put booked calls, form leads, missed calls, sales pipeline counts, or Google Ads pacing on a shared screen and keep the whole team aligned without asking anyone to learn a BI tool.
That day-to-day use case matters more than feature depth. For a plumber, med spa, law firm, or multi-location service company, the reporting problem is often not "we need more charts." It is "the office manager, owner, and call team need the same numbers in plain English during the day."
Geckoboard handles that well. Its layouts are easy to read from across a room, sharing is straightforward, and the setup burden is lighter than tools built for deeper analysis. BARC's BI Survey has reported that active employee use of BI and analytics tools sits at roughly a quarter of employees, which helps explain why simple, always-visible reporting often gets more real adoption than detailed dashboards hidden behind logins.
Here is where I see it fit in practice:
Office visibility: Good for TVs in a call center, service office, or sales bullpen.
Simple KPI tracking: Useful for leads, appointments, revenue pace, ticket counts, or response times.
Owner reporting: Clear enough for a business owner who wants quick status checks instead of monthly analysis sessions.
The trade-off is straightforward. Geckoboard is a display layer, not a full reporting system. If an agency needs to tie Google Ads spend to GA4 conversions, CRM opportunity stages, and closed revenue across several clients, the team will hit its ceiling quickly. The same goes for businesses that need drill-down analysis, custom attribution logic, or heavy data cleanup before a metric is trustworthy.
Used the right way, Geckoboard can still be valuable. It is a good choice for teams that already know which KPIs matter and want those numbers visible all day. It is a weaker choice for anyone still sorting out tracking, lead qualification, or cross-platform reporting logic.
8. Zoho Analytics
What if the report needs to do more than show clicks, form fills, and spend?
Zoho Analytics fits the point where a local business or agency starts asking harder questions. Which lead sources turn into booked jobs. Which locations close faster. Which sales reps follow up well enough to justify ad spend. That is the kind of reporting Zoho handles better than lighter marketing dashboard tools.
I usually see the best fit in two situations. A service business already runs part of the operation in Zoho, or an agency needs one reporting layer that can combine marketing data with CRM and revenue data without jumping straight to Power BI or Tableau. Google Ads, GA4, CRM records, and lead status can live in the same system, which matters if the owner wants one version of performance instead of four screenshots from four tools.
The trade-off is setup.
Zoho Analytics asks for clearer metric definitions, cleaner source data, and someone who can own the model. If call tracking names do not match CRM stages, or if lead sources are inconsistent across locations, Zoho will expose that mess fast. That is useful, but it also means the tool can feel heavier than expected for teams that mainly want polished monthly client reports.
A practical way to judge it is by the reporting question:
Need owner-friendly reporting that ties ad spend to leads, pipeline, and closed revenue? Zoho is a strong option.
Need agency deliverables that are fast to template, duplicate, and send across many clients? Other tools in this list are usually easier.
Need a middle ground between marketing dashboards and full BI stacks? Zoho often lands there.
As noted in Affirma's dashboard best practices, dashboard projects work better when teams define the audience, decisions, data sources, and refresh schedule before building visuals. Zoho rewards that approach. Teams that skip that planning usually end up with too many charts and not enough clarity.
For SMB reporting, that is the story. Zoho Analytics is less about flashy dashboards and more about building a reporting system the business can run. If the team will use CRM and lead-quality data alongside marketing metrics, it earns a serious look. If the goal is fast, presentation-ready client reporting with minimal modeling work, it can feel like more platform than the job requires.
9. Microsoft Power BI
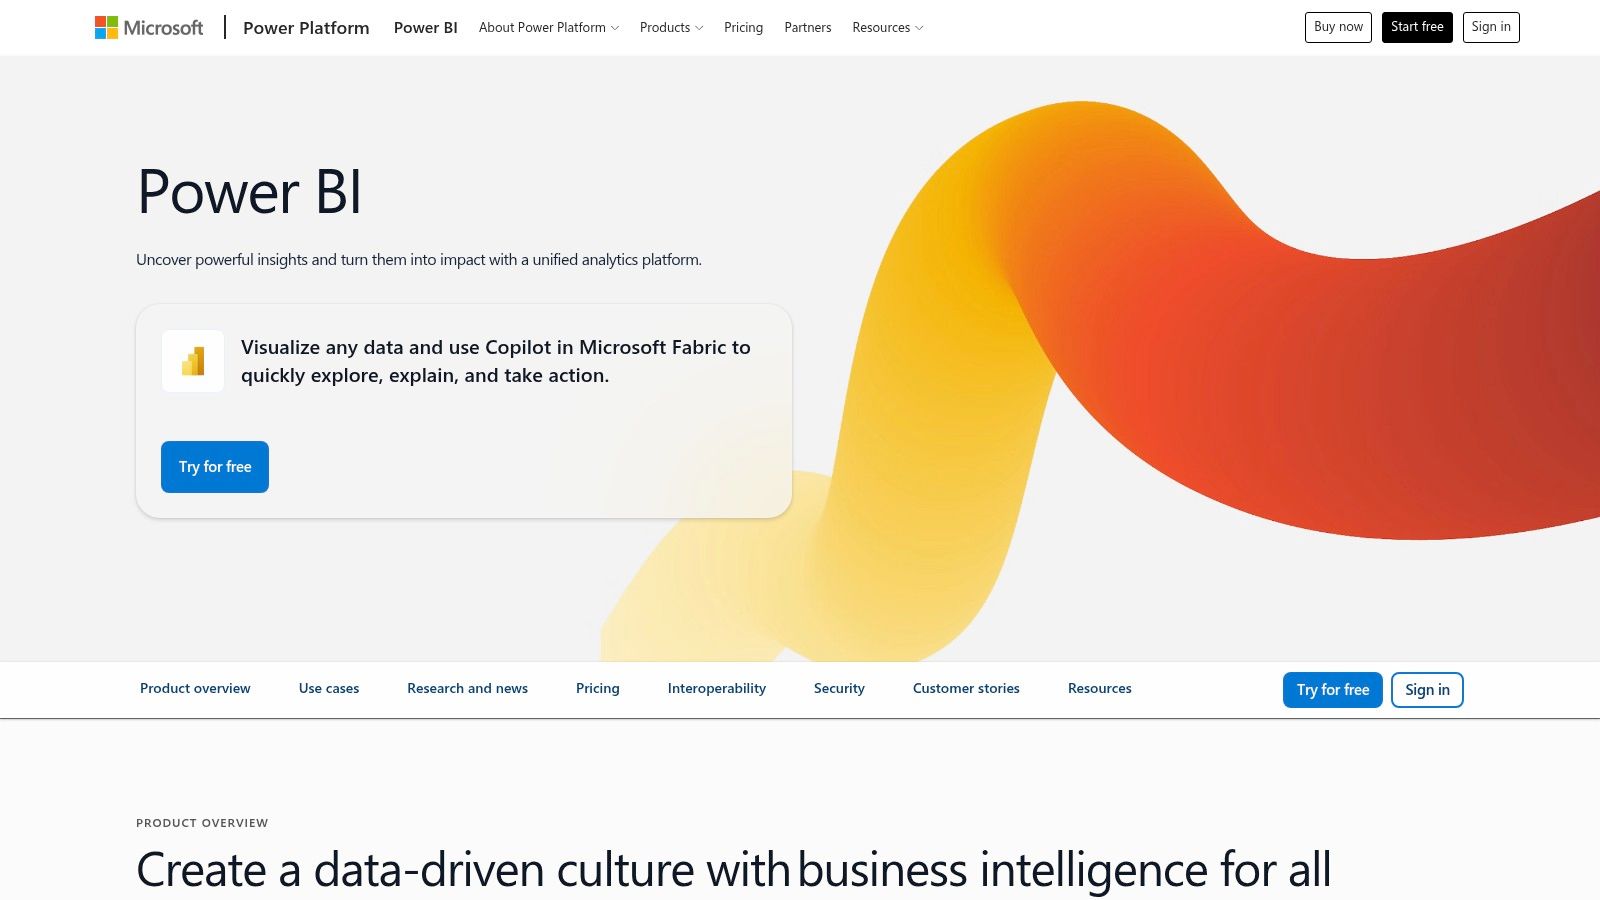
Microsoft Power BI starts to make sense once a business outgrows marketing-only dashboards. A local service company with multiple locations, a sales team, call tracking, and a CRM usually hits that point fast. At that stage, the reporting problem is no longer "show me Google Ads and GA4." It is "show me which leads turned into booked jobs, revenue, and margin, and limit who can see what."
That is the kind of job Power BI handles well.
I usually would not put it first on the list for a small shop that wants simple monthly reports for the owner. Setup takes real thought, and someone has to maintain the model. But for agencies serving more operationally mature clients, or SMBs that need one reporting layer across marketing, sales, and finance, Power BI gives you more control than the lighter dashboard tools in this list.
Its value shows up in the messy middle of real reporting work:
Google Ads and GA4 need to tie back to CRM stages, not just platform conversions.
Call tracking data needs consistent source naming before anyone trusts lead volume by channel.
Different users need different access, especially across locations, departments, or franchise groups.
Revenue logic often needs cleanup before dashboards can reflect booked work, closed revenue, or job value accurately.
Power BI is strong at that cleanup and control layer. Power Query helps teams shape data before it reaches the report. DAX gives analysts room to define lead quality, cost per booked job, close rates, and other business-specific metrics that off-the-shelf reporting tools often gloss over. Row-level security matters too. A regional manager can see only their branch, while ownership still gets the full view.
The trade-off is time and skill. Power BI can absolutely produce clear owner or client reporting, but it does not hand that to you by default. If the underlying data model is sloppy, the charts will still look polished while the numbers stay disputed. That is why this platform fits best when somebody on the team can own definitions, refreshes, and access rules.
One practical test helps here. If the business asks questions like "Which campaigns produced qualified calls that became paying jobs?" or "Why does location A close more leads than location B on the same ad spend?" Power BI is a serious contender. If the main need is faster recurring reports with less setup, it is often more platform than the job requires.
If the person building the dashboard cannot explain refresh logic, source logic, and permission logic, Power BI will expose that weakness fast.
10. Tableau (Salesforce)
Tableau makes the most sense after a business has outgrown template reporting.
For a local service company or SMB agency, that usually means the basic questions are already settled. Google Ads, GA4, CRM data, call tracking, and booked-job metrics are flowing into one place. The next problem is not building another monthly summary. It is giving operators, managers, and owners a way to ask better questions without rebuilding the report every week.
That is where Tableau earns its cost.
A multi-location home services brand is a good example. Leadership may want branch-level performance by market, campaign type, lead source, technician capacity, and closed revenue. The marketing team wants to isolate why one location turns the same ad spend into more booked work. Sales wants to see where lead quality drops between first contact and appointment set. Tableau handles that style of analysis well because the interface supports filtering, drilling, and exploring without turning every request into a custom dashboard project.
It also tends to produce better executive-facing visuals than many mid-market reporting tools, especially when the audience expects polished presentations as well as analysis. That matters more than some teams admit. Clear visuals help owners and clients follow the story from spend to lead to revenue, especially when the numbers come from several systems and the logic needs explanation.
Still, Tableau is rarely the practical first pick for a smaller agency or a single-location business. Teams that mainly need recurring Google Ads and GA4 reporting, plus CRM lead counts and monthly trend snapshots, often end up paying for depth they will not use. Setup takes planning. Metric definitions still need to be cleaned up outside the chart layer. Someone has to own the reporting environment.
The key question is simple. Will people explore the data, or just read the report?
If the workflow is interactive analysis across ad platforms, CRM stages, locations, and revenue outcomes, Tableau is a serious option. If the workflow is sending understandable client or owner reports on a schedule, a simpler platform usually fits better and gets adopted faster.
Top 10 Dashboard Reporting Tools, Feature Comparison
Tool | Core features ✨ | UX / Quality ★ | Value & Pricing 💰 | Target 👥 | USP 🏆 |
|---|---|---|---|---|---|
Google Data Studio (Looker Studio) | Native GA4/Ads/Search Console/BigQuery connectors; many 3rd‑party feeds | ★★★★☆ | 💰 Free core; Pro adds per‑user governance | 👥 Google‑stack users, small–mid agencies | 🏆 Best native GA4/Ads reporting |
AgencyAnalytics | 85+ marketing integrations, white‑label portals, automated reports, SEO rank tracking | ★★★★☆ | 💰 Client‑based pricing; scales per client | 👥 Agencies needing fast, multi‑client reporting | 🏆 Rapid white‑label deployment at scale |
DashThis | Prebuilt PPC/SEO/social templates, unlimited integrations, calculated widgets, PDF/email scheduling | ★★★★☆ | 💰 Predictable plans by dashboard/source | 👥 Agencies delivering monthly client reports | 🏆 Clean, low‑friction client PDFs |
Databox | 130+ integrations, AI (Genie), anomaly detection, sub‑accounts & TV/mobile display | ★★★★☆ | 💰 Agency plan + client packs; cost‑effective scaling | 👥 KPI‑focused agencies & teams | 🏆 Strong AI‑assisted KPI storytelling & alerts |
Whatagraph | Broad marketing & CRM integrations, polished visuals, white‑label portals, scheduled multi‑format delivery | ★★★★☆ | 💰 Mid–high pricing for presentation‑grade reports | 👥 Agencies/clients needing executive decks | 🏆 Best out‑of‑box visual polish |
Klipfolio (Klips & PowerMetrics) | Custom Klips + governed PowerMetrics, many integrations, custom data feeds | ★★★★☆ | 💰 Mid; scalable via sales/plans | 👥 Agencies needing deeper customization | 🏆 High customization without full BI complexity |
Geckoboard | Real‑time KPI widgets, public/share links, TV display mode, simple setup | ★★★☆☆ | 💰 Affordable; low admin overhead | 👥 Teams wanting always‑on TV dashboards | 🏆 Easiest TV/display deployment and sharing |
Zoho Analytics | Cloud BI with data prep, modeling, wide connectors, scheduled sharing | ★★★★☆ | 💰 Budget‑friendly BI pricing | 👥 SMBs and Zoho‑centric clients | 🏆 Cost‑effective full BI capabilities |
Microsoft Power BI | Power Query/DAX modeling, paginated reports, RLS, deep M365/Azure integration | ★★★★★ | 💰 Pro → Premium PPU/capacity; strong ROI at scale | 👥 Enterprises, data warehouses, analysts | 🏆 Robust modeling, governance & scale |
Tableau (Salesforce) | Powerful visual analytics, governed sources, Cloud/Server options | ★★★★★ | 💰 Higher TCO; enterprise licensing | 👥 Analysts & execs needing interactive exploration | 🏆 Industry‑leading visual exploration and interactivity |
Choose the Dashboard That Drives Better Decisions
The right dashboard reporting tool starts with the reporting job, not the brand name. If the business already lives in Google Ads, GA4, Search Console, and Sheets, Looker Studio is still the cleanest low-cost starting point. If an agency or consultant needs repeatable client reporting, tools like AgencyAnalytics, DashThis, Databox, and Whatagraph usually make more sense because they reduce delivery friction. If reporting has to connect marketing, CRM, operations, and permissions with tighter logic, Zoho Analytics, Power BI, or Tableau are stronger fits.
The easiest way to choose is to ask five plain questions.
Which dashboard reporting tools work with Google Ads and GA4
Most of the tools in this list can connect to Google Ads and GA4, but the experience isn't the same across platforms. Looker Studio is the natural first choice for Google-stack simplicity. AgencyAnalytics, DashThis, Databox, and Whatagraph are often better when you need client-ready recurring reporting. Power BI, Tableau, and Zoho Analytics fit teams that want to combine Google data with CRM, finance, or operational sources.
Does a local business need paid dashboard software
No, not always. A small business can do a lot with a free or low-cost setup if the tracking is clean and the reporting questions are narrow. Paid software starts to make more sense when the business needs white-label client reporting, stronger automation, easier sharing, better mobile access, or more advanced data modeling.
How should a local business report calls and leads
The dashboard should connect ad platforms, website activity, call tracking, forms, CRM outcomes, and lead status. That's where many dashboards still come up short. Industry coverage notes that a common weakness in analytics dashboard tools is showing activity instead of outcomes, especially when trying to connect ad spend, website sessions, and customer-level revenue or profit in one place, as discussed in Layer Five's review of analytics dashboard gaps for marketing teams.
For local service businesses in Prescott and across Northern Arizona, that distinction is huge. Calls, booked estimates, qualified leads, and closed jobs matter more than impressions or raw click totals.
How often should dashboards be reviewed
Live dashboards are useful for daily or weekly operational checks. Strategy reviews usually work better weekly or monthly, depending on budget size and lead volume. The key is consistency. A dashboard no one opens isn't a reporting system.
A practical adoption metric helps keep that honest. Dashboard adoption can be measured as active dashboard users divided by total users with access, multiplied by 100, according to Diggrowth's definition of dashboard adoption rate. If managers, owners, or sales staff have access but never log in, the tool is too complex, poorly aligned, or both.
What should a business watch besides marketing KPIs
The best dashboards also track whether the data itself is trustworthy. A data quality dashboard monitors things like freshness lag, row-volume variance, null rates, duplicate rates, schema changes, and failed checks, as explained by Data Observability's overview of data quality dashboards. Common quality metrics also include completeness, accuracy, consistency, timeliness, validity, and uniqueness, with plain-English definitions outlined in FanRuan's guide to data quality dashboard metrics.
That matters because a wrong number with a nice chart is still a wrong number.
For businesses in Prescott, Prescott Valley, Chino Valley, Dewey-Humboldt, and the surrounding Northern Arizona market, the best reporting setup is usually the one that stays understandable as the business grows. Silva Marketing's approach fits that reality. The agency focuses on custom websites, SEO, and Google Ads with reporting that ties performance back to leads and cost per lead, rather than burying owners in decorative dashboards. If the goal is authority, measurable lead flow, and clear reporting across local service areas, a simpler dashboard with strong tracking usually beats a complex one with weak adoption.
A calm next step is to review the data sources you already use, define who needs to see what, and choose the lightest tool that can answer the decisions you make every week.
If you want help sorting that out, Silva Marketing builds custom reporting around the channels local businesses use, including websites, SEO, Google Ads, and lead tracking. You can learn more about the agency's Prescott-based work and request a no-pressure conversation at Silva Marketing.
Comments